Image source: Bigstock ©tombaky
That depends on many factors, including your time frame, and the types of stocks that are part of your portfolio. Many retirement planning calculators project a portfolio’s future value based on historical returns. However, please remember that past performance is not a guarantee of future results, and it is always good to question such assumptions.
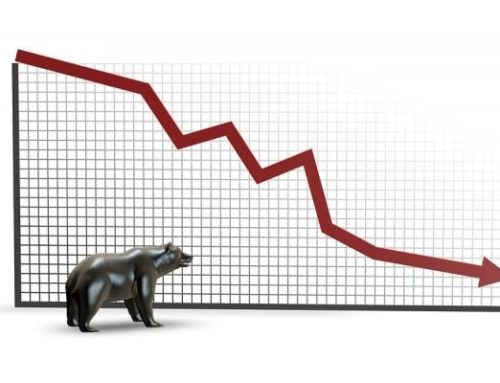
You probably have heard that stocks have averaged around a 10% return over longer time periods. However, don’t rely too much on that number. Question the basis of that statement…9.8% reflects the compounded annual total return of the S&P 500 over the last 85 years. Is your time frame that long? Recently, the rate of return of stock portfolios has not been that good. The last time the S&P’s annual 10-year return was around 10% was 2004… from 1999 to 2008 it was negative, and from 2003 to 2012 it was around 7%.
These oft-quoted returns don’t take into account inflation or taxes. Right now, the annual inflation rate is at a historically low level of around 1%. However, for longer term planning, you should assume an inflation rate of at least 3%. Remember to subtract at least 3% from your future projections to come up with a “real” number…one that will help you relate the number of goods and services you can buy in the future, with those that you can buy today.
Returns for stocks other than the often-quoted S&P 500 will be different. A well diversified portfolio will include bonds, cash, and perhaps even alternative investments, as well as stocks. If you would like to construct your own diversified portfolio, but are not sure how to get started, please contact me, and we’ll have an obligation-free discussion.


Leave A Comment
You must be logged in to post a comment.